ER
(reactions + forwards + comments) ÷ views × 100, per post. How much of the audience that saw the post reacted to it.
Analytics
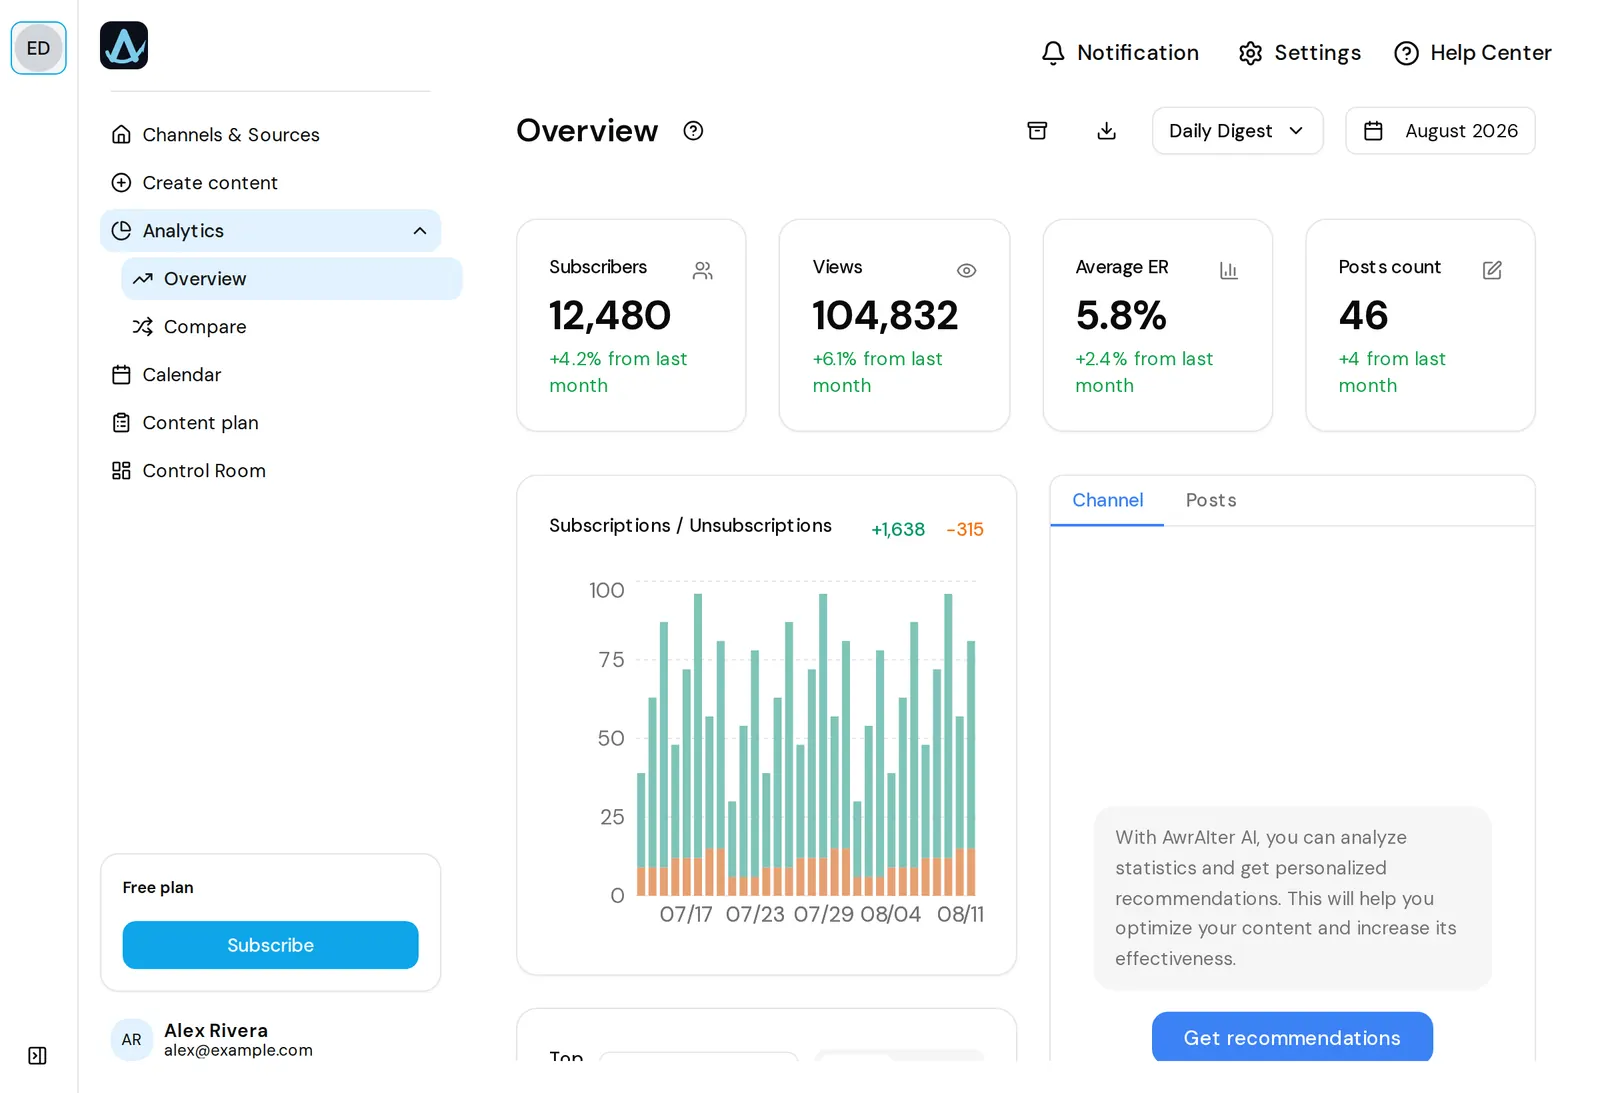
AwrAiter reads statistics from Telegram for every channel you connect and shows them next to the posts: views, reactions, forwards, comments, ER and ERR, subscriber growth by day. The formulas are the ones TGStat uses, so your numbers are comparable with what advertisers check. The difference: you see all of your own channels on one screen, with the post text right there.
01 — What you get
Views, reactions, forwards, comments, ER, the publishing slot, and how the post compares with the channel's 30-day median.
Subscriber growth, ER and ERR over 1–90 days, top and flop posts, the slots that work for this audience.
The Control Room: every channel the team runs, with the ones that need attention first — empty queues, failed posts, channels gone quiet — on one screen.
The MCP tool get_channel_insights hands the top and flop posts, with texts and slots, to ChatGPT or Claude so it writes in what works. Details are part of paid plans.
02 — The numbers, defined
(reactions + forwards + comments) ÷ views × 100, per post. How much of the audience that saw the post reacted to it.
The same numerator ÷ subscribers × 100. Useful when comparing channels of similar size.
Average views per post ÷ subscribers × 100. The share of subscribers a post actually reaches.
Subscribers by day, with the delta over the period. Both joins and leaves are visible.
Which hours and weekdays collect the most views and reactions — for this channel, from its own history.
A daily export of every channel to the Google Sheet you set for the team, for reports you already build.
03 — Benchmarks
Per-channel medians across channels run in AwrAiter, 90 days to 2026-09-03: 19 channels, 7442 posts; a channel counts with at least 10 posts and 100 subscribers. Small sample, real numbers — use them as a sanity check, not a target. Buckets with fewer than five channels are not shown.
| Channel size | Channels | Posts | ER (median) | ER by subscribers | ERR (reach) |
|---|---|---|---|---|---|
| < 1 000 | 6 | 1276 | 1.7% | 0.36% | 4.6% |
| 1 000 – 10 000 | 13 | 6166 | 1.6% | 0.30% | 21.3% |
A tiny channel with 40% ER is not a phenomenon: the denominator is small. Compare within a size bucket, and watch ERR — reach is what an advertiser buys.
04 — Questions
No. Only channels where the AwrAiter service account is an admin. For market research use TGStat or Telemetr; AwrAiter is for the channels you run.
Yes. ER, ER by subscribers and ERR are computed with the same formulas. Small differences come from the moment of capture.
Several times a day for every connected channel.
Yes, in the Control Room, and through the MCP tools get_channel_stats and deep_analyze (the latter compares several channels and spends AI credits).
Yes, when the channel has a linked discussion group; comments are read from it.
History loads on connection. One channel is free, no card.